Preface
In this second installment of our series, we'll run through installing and configuring the utilities necessary for building out a centralized logging system. As numerous how-to guides exist that explore the subject we'll approach a majority of things at a higher level, while exploring solutions to roadblocks we encountered along the way.
Note that the steps below are intended for a basic test lab environment and should not be used in large scale deployments unless they are thoroughly tested and understood. Furthermore, we haven't made any major attempts to secure the ELK infrastructure beyond what is provided as default. For more information on configuring ELK deployments securely, refer to the official Elastic documentation here.
Quick Steps To Get Up and Running
We started with a fresh install of Ubuntu 20.04. The following code blocks demonstrate crucial steps and configuration details identified while following elastic.co's excellent installation guides. We can start by adding and configuring elastic's apt repository and installing the ELK stack (as root):
wget -qO - https://artifacts.elastic.co/GPG-KEY-elasticsearch | apt-key add -
apt install apt-transport-https openjdk-14-jdk
echo "deb https://artifacts.elastic.co/packages/7.x/apt stable main" | tee -a /etc/apt/sources.list.d/elastic-7.x.list
apt update
apt install elasticsearch kibana logstash
Configure elasticsearch to listen on all network interfaces via changes to /etc/elasticsearch/elasticsearch.yml:
# ---------------------------------- Network -----------------------------------
#
# Set the bind address to a specific IP (IPv4 or IPv6):
#
network.host: 0
discovery.type: single-node
Similarly, modify /etc/kibana/kibana.yml:
# Specifies the address to which the Kibana server will bind. IP addresses and host names are both valid values.
# The default is 'localhost', which usually means remote machines will not be able to connect.
# To allow connections from remote users, set this parameter to a non-loopback address.
server.host: "<HOST IP HERE>"
Finally, copy over the sample config to /etc/logstash/conf.d:
cp /etc/logstash/logstash-sample.conf /etc/logstash/conf.d/sample.conf
With the services configured, enable and then start them with the following systemd commands (as root):
systemctl enable elasticsearch
systemctl enable kibana
systemctl enable logstash
systemctl start elasticsearch
systemctl start kibana
systemctl start logstash
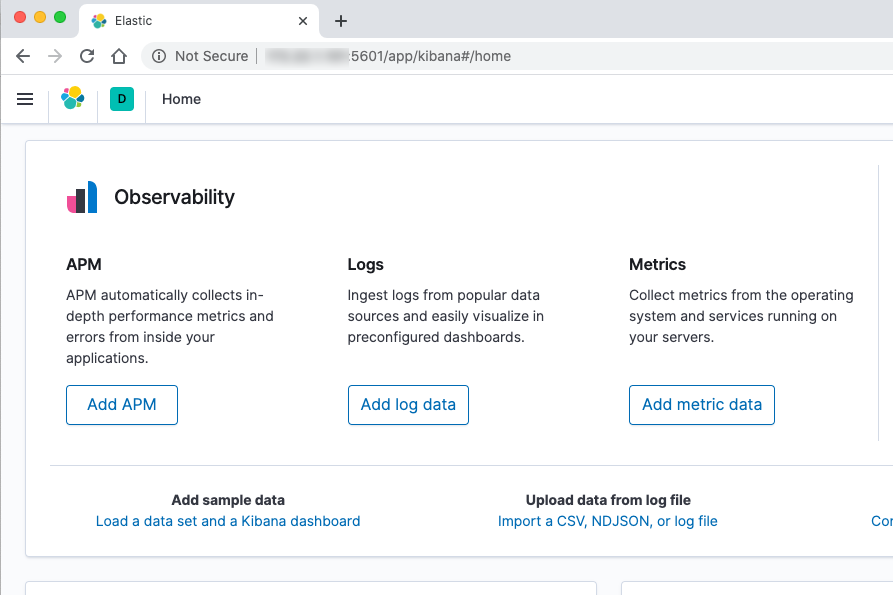
At this point you should be able to browse to http://YOUR_HOST:5601.
Deploying Sysmon
In an effort to simplify deploying Sysmon across a domain, we elected to modify a batch file (originally found here) and create a scheduled task following the referenced post's recommendation.
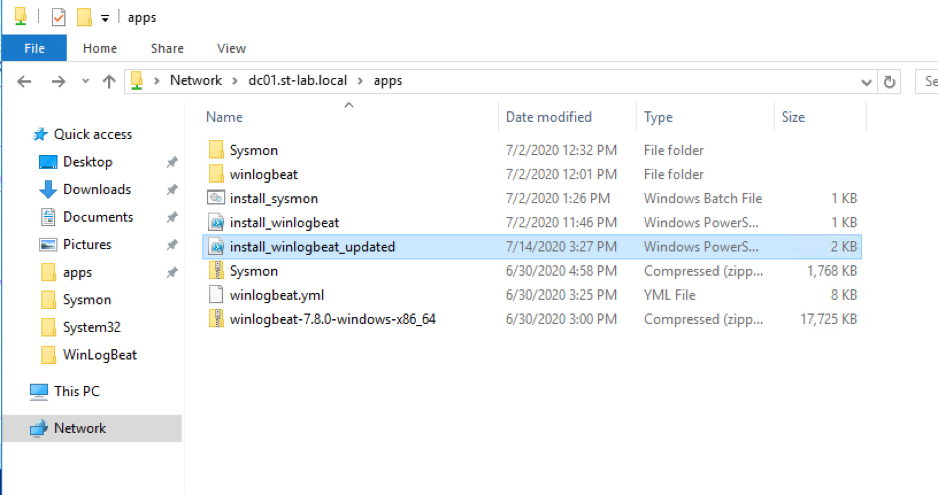
Our lab domain (st-lab.local) consists of two domain controllers (DC01 and DC02), two Windows Server hosts (SPIDERS and GARBAGE) as well as three workstations (WK01-WK03). We created a network share on DC01, and placed the requisite files inside.
It is important to ensure that any script or batch file is owned by a domain admin, with only read and execute permissions allowed for all other users - since the batch file runs under the 'NT AUTHORITY\System' context, this file could be used to execute an attacker's code if proper permissions aren't set.
As far as Sysmon rules go, SwiftOnSecurity has aggregated a documented list that is quite thorough. We consider this an outstanding starting point, and is presented in a manner that allows for easy rule customization and creation.
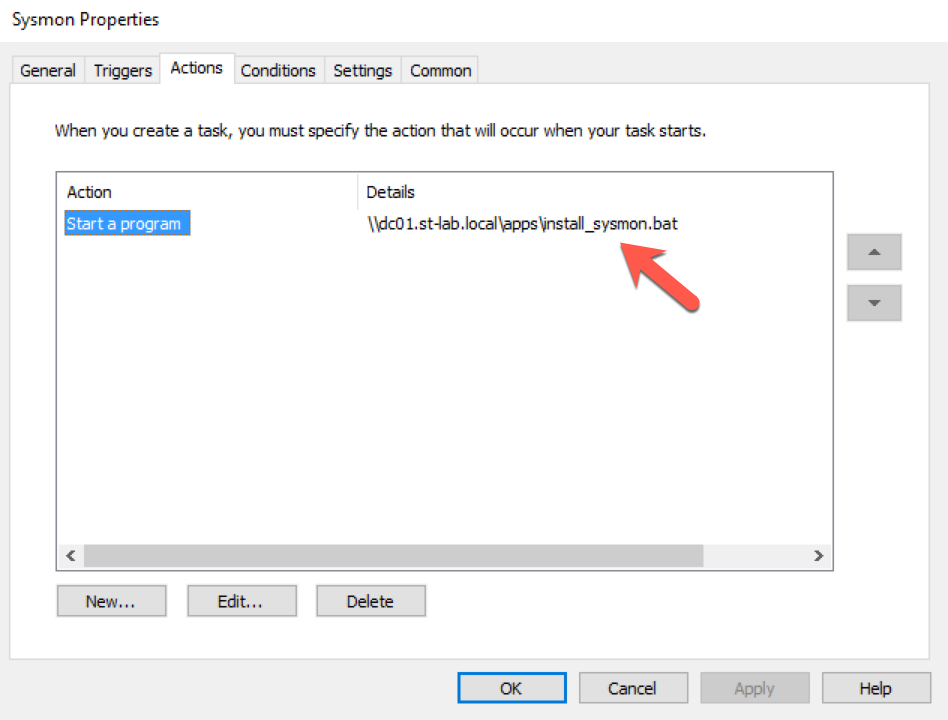
The following screenshot details the modified batch file for Sysmon deployment. Stepping through the process, the script attempts to compare a local Sysmon configuration file with one residing on a fileshare. If the file doesn't exist or is different, it is copied from the fileshare. The remaining 'if' statements either restart the service if it existed, or installs it altogether.
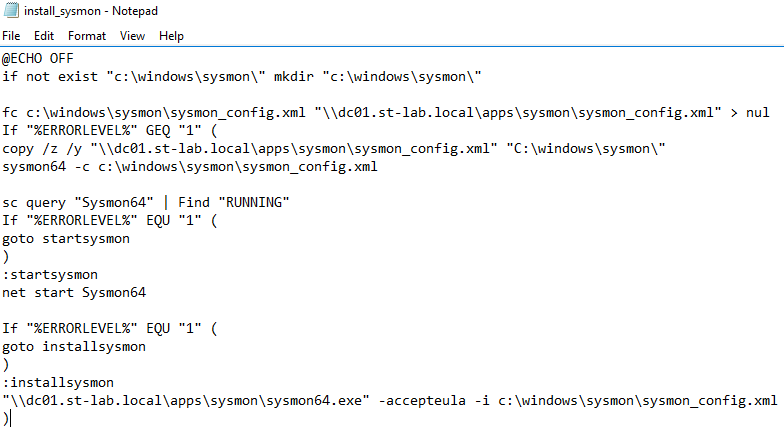
Script source can be found here.
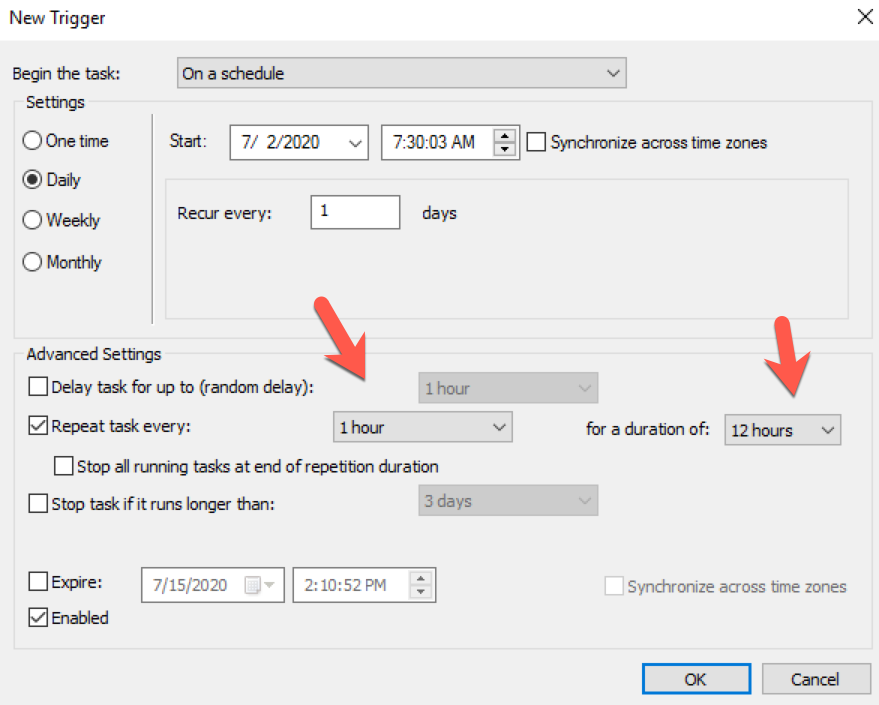
With the batch file accessible on the share, we then created a GPO to add a scheduled task. This task runs for twelve hours starting at 7:30am every day of the week. Without changes to the Sysmon configuration file on the fileshare, the batch file itself does nothing. Should changes be made to the Sysmon configuration, the 'fc' component of the batch file will initiate retrieval of the updated configuration file and reconfigure Sysmon.
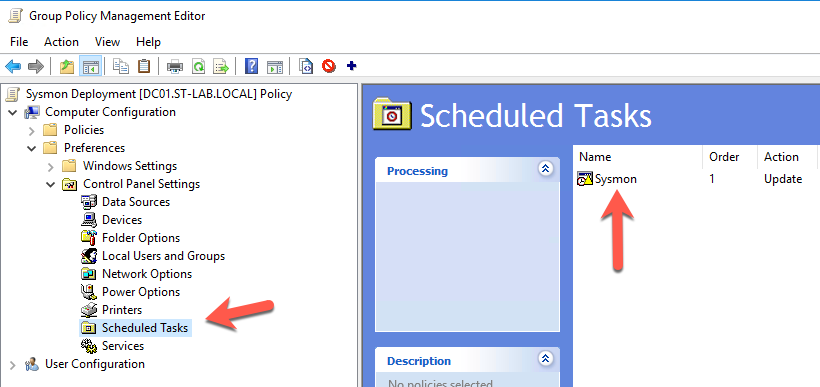
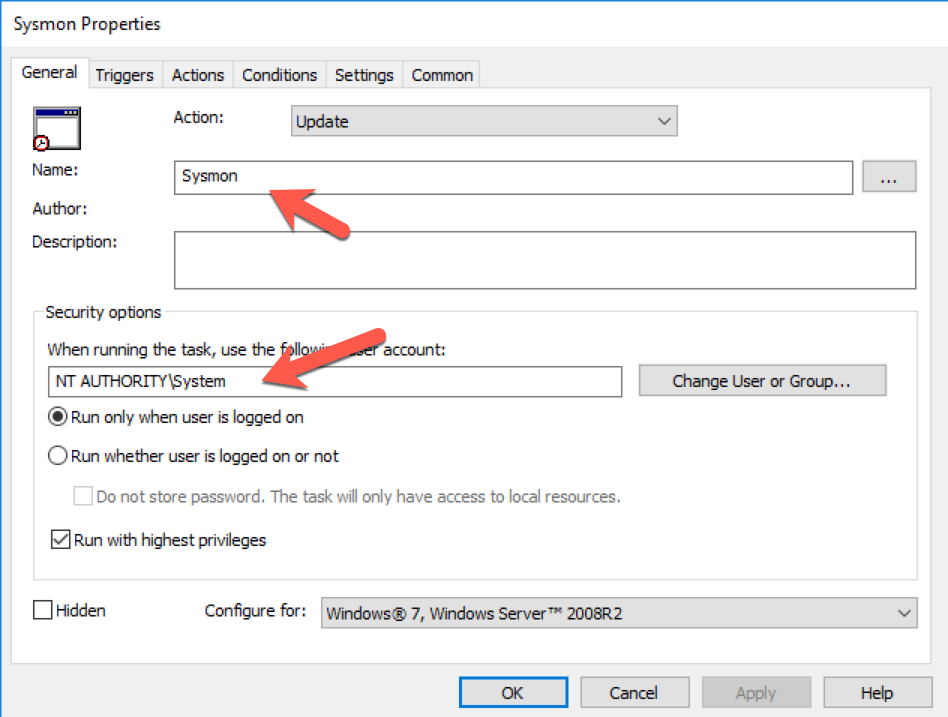
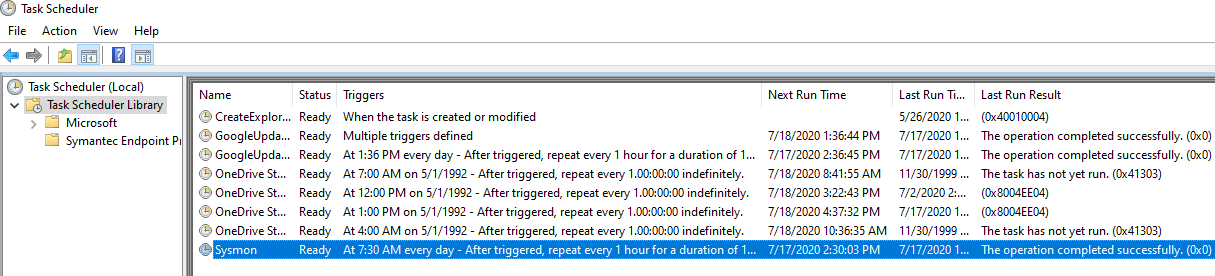
Once applied to the domain, wait a bit for hosts to update the group policy, or run gpupdate /force on the hosts. You can verify the addition of the scheduled task by opening the Task Scheduler as an administrative user.
Collecting Results With Winlogbeat
At this point we have a place to aggregate and process logs, and we've configured Sysmon to keep an eye on a few areas. The last piece of the puzzle is installing Winlogbeat so that we can push those logs back to our ELK stack. This process proved to be slightly tricky, but we have documented our challenges and solutions below.
We ended up expanding Winlogbeat's install script, written in PowerShell, to copy source files from our fileshare and write an updated config file.
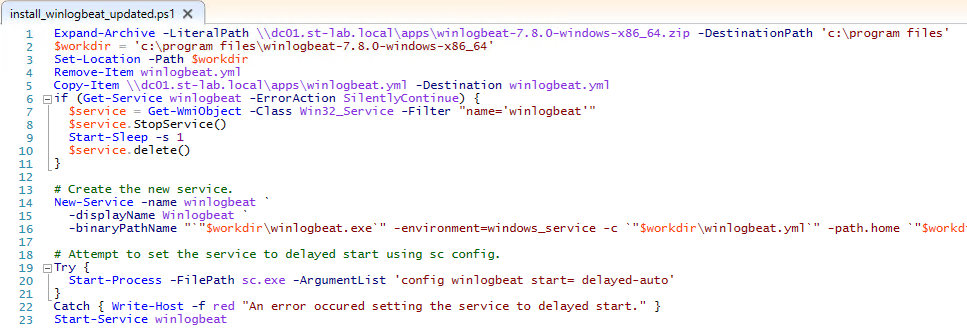
Script source can be found here.
Line 1 details unzipping the Winlogbeat archive hosted on the fileshare to the local host. Subsequent lines define a working directory, remove the default Winlogbeat configuration file, and copy over an updated configuration from the fileserver. Lines 6 through 22 are borrowed from Winlogbeat’s installation script, with line 23 starting the service itself.
In our testing environment, Winlogbeat was installed manually on a single host to verify configuration details. Since we utilize logstash in our log flow, additional first-time configuration was necessary. Elastic details this process in the documentation for Winlogbeat – Load the index template in Elasticsearch. Here’s the relevant excerpt:
PS > .\winlogbeat.exe setup --index-management -E output.logstash.enabled=false -E 'output.elasticsearch.hosts=["<elastic host>:9200"]'
With the template installed, we can deploy Winlogbeat across the target systems in the domain. PowerShell’s Invoke-Command can be leveraged to run scripts or commands on remote domain-joined hosts; however, we ran into the Kerberos “Double Hop” issue as the install script itself is located on a network share that requires authentication. By default, authentication only extends to the first hop (from server to target) leaving the target’s network call without accompanying credentials. After much Googling, details found in this post helped us to allow credential delegation.
With the following code example, we allow all hosts within the active directory environment to delegate credentials to the file server (in this case, DC01).
$FileServer = Get-ADComputer -Identity dc01
$Servers = Get-ADComputer -Filter {Name -ne $FileServer.Name} -SearchBase 'DC=st-lab,DC=local' -SearchScope Subtree
Set-ADComputer -Identity $FileServer -PrincipalsAllowedToDelegateToAccount @($Servers)
Once the change has taken effect on the host (by either waiting for 15 minutes, or by running KLIST PURGE -LI 0x3e7 on a target) we can test if a target can access the fileshare during script execution. First, we snag administrative credentials:
$cred = Get-Credential st-lab\super.duper
And then execute Invoke-Command:

Great success!
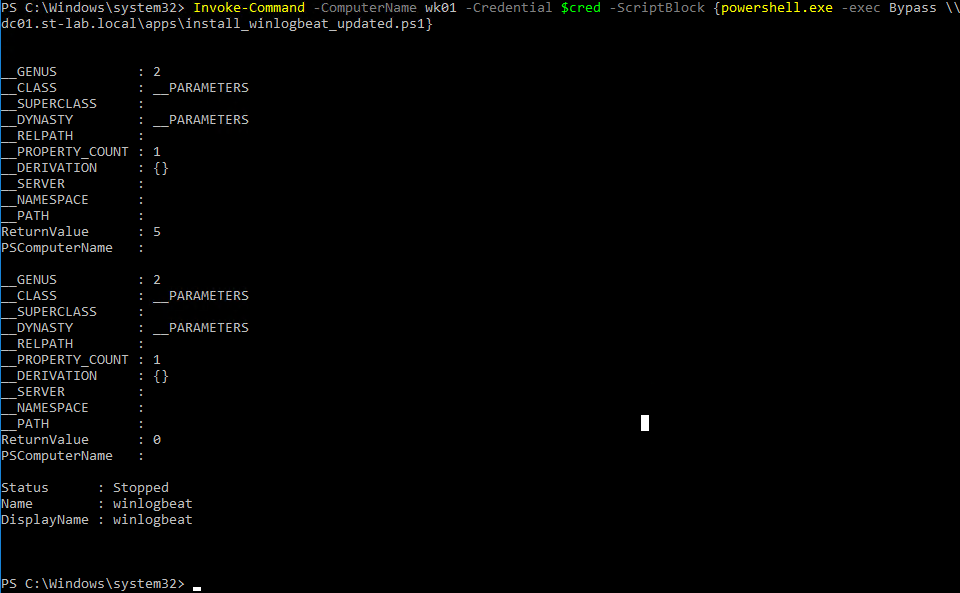
With authentication issues solved, we can utilize Invoke-Command to install winlogbeat on a target:
Here we can see the file comparison we set up for the Sysmon deployment (within the Kibana browser interface):

Final Thoughts
Although cumbersome at times, leveraging these freely available utilities to bolster endpoint monitoring capabilities may provide invaluable insight to your organization. On the red team side of the house, understanding how monitoring and log aggregation solutions may be deployed encourages us to learn our environment and avoid actions that may trigger alerts in an organization's SoC.
In our next installment, we'll dig deeper into configuring Sysmon and provide examples of what typical threat actor activities look like from a logging perspective.
Scripts
Below you can find the links for the batch file used to deploy Sysmon, as well as the PowerShell script used for deploying Winlogbeat. Replace instances of NETWORK_PATH with the appropriate share for your domain, and ensure your baseline winlogbeat.yml and sysmon_config.xml files exist.