Preface
This is the first in our series of important skills and habits that we use at STACKTITAN to help us level up our technical tradecraft. We aren’t going to be dropping 0-days or talking about the latest nation-state malware, but instead covering (what we feel are) important topics that don’t get a lot of airtime on traditional social media outlets or blog posts. These are practices that anyone performing adversarial red-team testing can use to gain insight into various defensive strategies.
Information Overload
Let’s face it. As red teamers and penetration testers, we feel an immense pressure to be experts about everything related to security. Latest attack techniques, new technology stacks, networking, malware advancements, the list goes on and on. We all want to be able to pump out 0-days like candy from a PEZ dispenser while also hunting down cutting-edge nation state malware with nothing more than a bash terminal and a case of Red Bull.
But we can’t. It’s just not feasible. (Ok, maybe you can, but I certainly can’t. :P)
But that’s ok. We can still learn some really useful information through the eyes of our blue team kin that can help us hone our tradecraft. Furthermore, learning blue team techniques is a good way to make sure you are aware of potential pitfalls when you are performing evasive testing in a client environment. A fully evasive red team assessment isn’t much use to a client when you get burned the first time you pop a shell and try to inject into “notepad.exe.”
Embrace the Blue
At STACKTITAN, we believe that offensive security offerings should mimic real world threats as realistically as possible in order to give our clients a “practice run” of what a real attack would look like. Sophisticated real-world attackers aren’t normally going to be running Nexpose and throwing it into Metasploit Pro. For that reason, we tend to rely on evasive methods and custom tooling during our assessments. One resource that we find invaluable is Sysmon.
If you aren’t aware of it already, Sysmon is a free tool that is part of the SysInternals suite by Mark Russinovich and Thomas Garnier. Windows default logging is severely lacking, and Sysmon enables users to drastically increase Windows event logging while also creating custom rules to generate different types of Windows alerts respective to various activities. This is particularly useful to defenders, as it allows them to generate rules to detect and alert on common attacker behavior.
For example, Sysmon can alert on various types of events, such as:
- Network connections
- Process starts
- File system events
- Driver loading
- DNS lookups
- And more
Sysmon is also an incredibly useful tool to us as attackers. When we turn up all the logging features of Sysmon, it gives us fantastic insight into what type of artifacts and events different tools and activities create in a Windows environment. That insight lets us further tune our techniques to minimize our footprints in an environment. If you haven’t done this before, it is sometimes surprising to find out how loud many commonly used offensive tools really are.
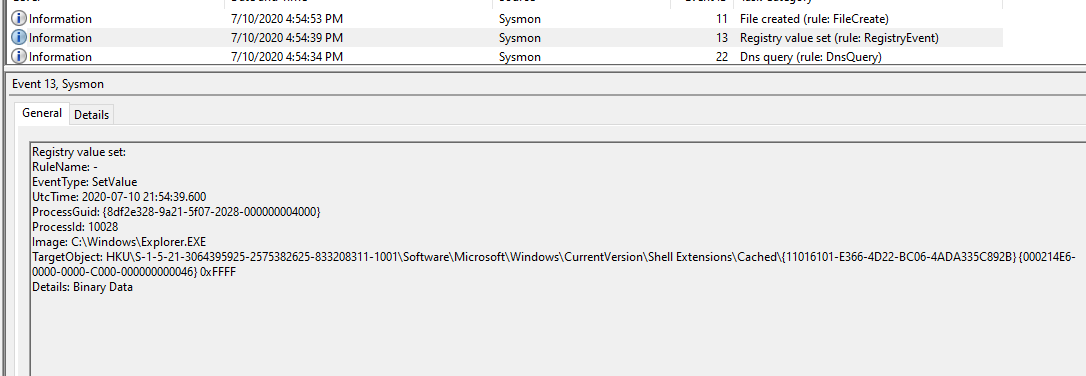
However, a Sysmon instance that is configured to report on a system’s chosen activity usually generates enormous amounts of noise and events. Analyzing these events in Windows event viewer is cumbersome at best and impractical at worst. The following screenshot provide a glimpse of Sysmon enabled to augment windows logging.
For that reason, many people use an off-host log correlation solution to receive, parse, and index event logs from Sysmon and elsewhere. There are a number of solutions, such as the widely popular Splunk. However, at STACKTITAN, we prefer the ELK stack for this task. The ELK stack (also known as the Elastic Stack) is a combination of three free and open source projects, along with an additional set of resources necessary to pull log data from various network systems. These are listed as follows along with an illustration of the powerful Kibana dashboard provided as part of the ELK stack.
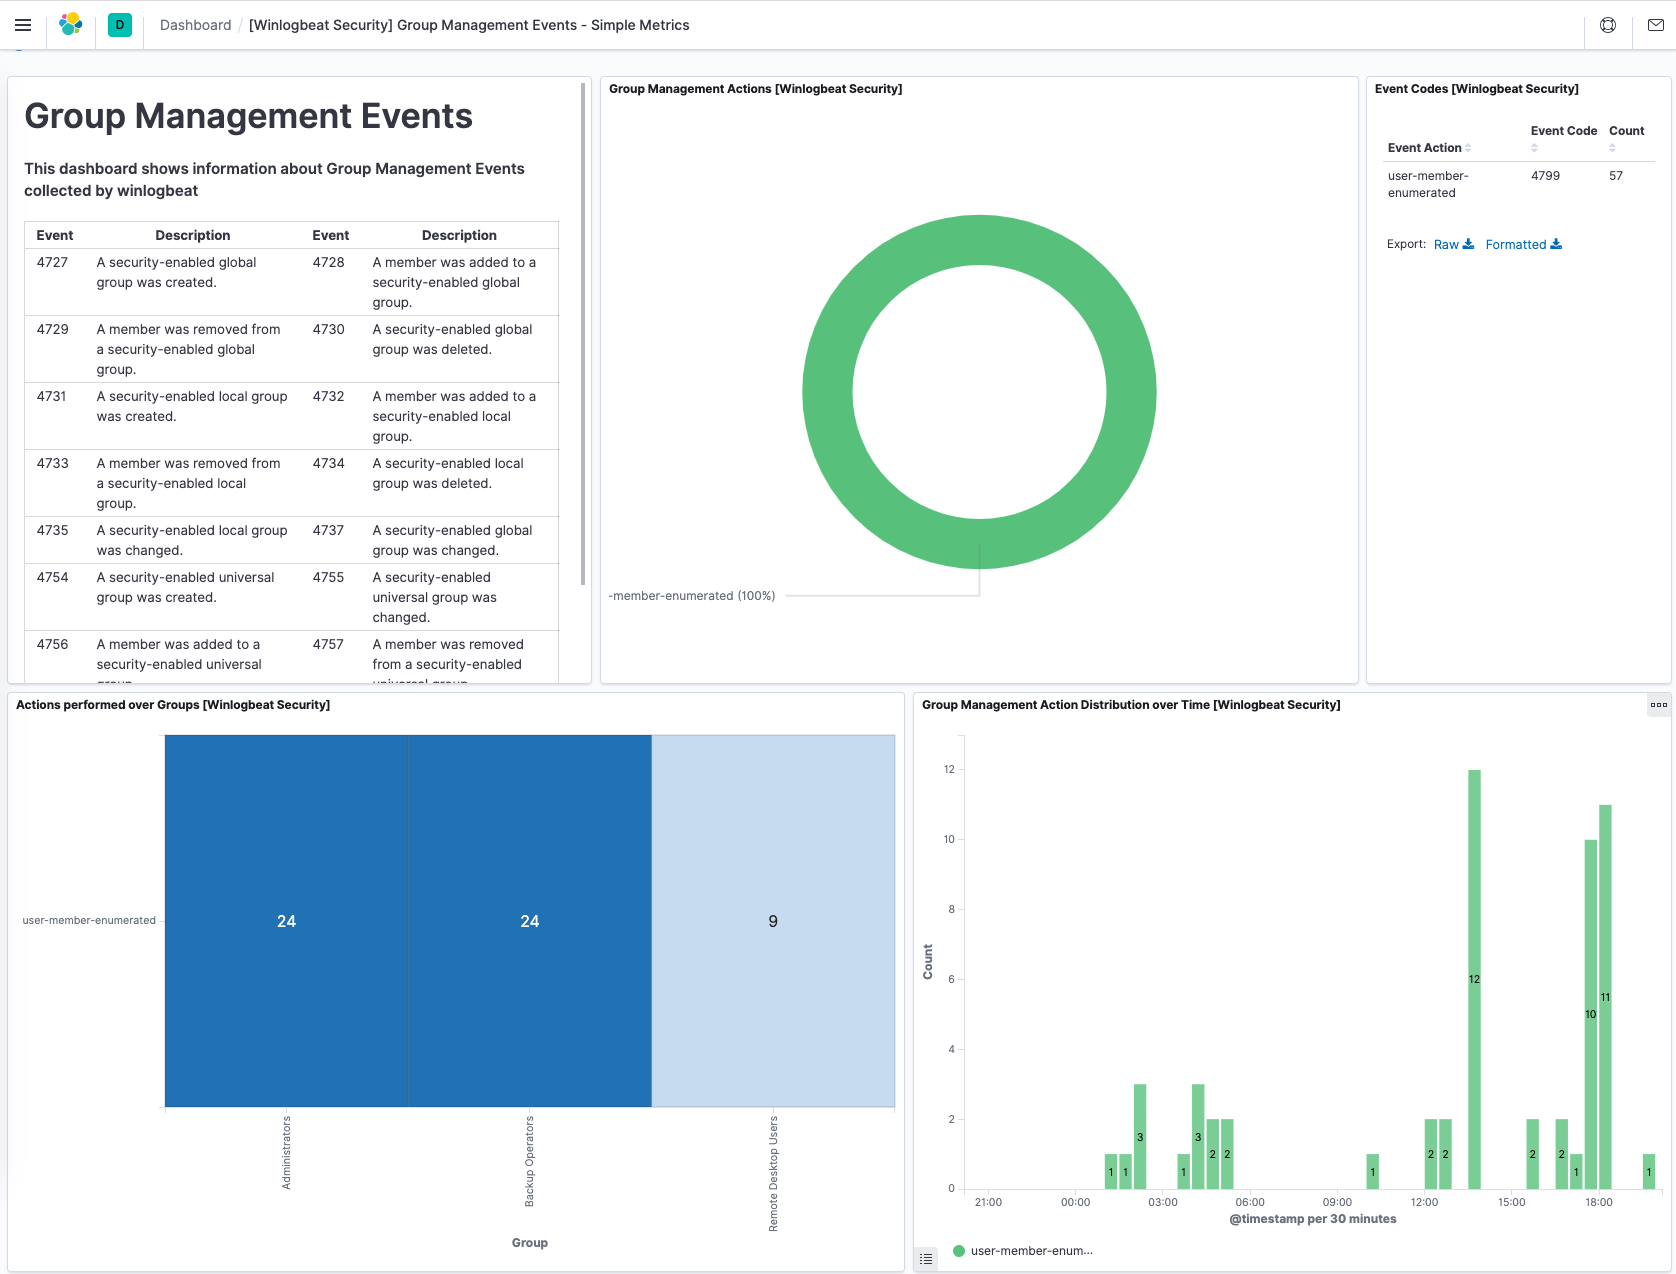
Elasticsearch is a powerful, text based search engine that also allows us to analyze logs as they are indexed by the overall ELK stack. Logstash receives the actual logs from our lab machines and transforms the log data into a more digestible format before it is indexed by Elasticsearch. Finally, Kibana is a dashboard/visualization software that gives us easy ways to monitor and discover any trends or ongoing alerts. To get the Sysmon logs into our ELK stack, we use Beats, which are lightweight agents that are placed on each endpoint and configured to ship local Sysmon logs to Logstash for processing.
Final Thoughts
STACKTITAN performs a lot of red team work, and it never fails that both we as the adversary and the defending teams bump up against one-another. This is as it should be and, more importantly, these interactions should prove to be educational learning moments for all parties involved. The process of continually learning defensive techniques elevates not only our tradecraft but also the conversation around threats and their tactics, overall.
This was a relatively brief post, but it serves to set the stage for more detailed content associated with the tool-stack and the methods for deriving useful defensive information. In the next post, we will be covering how to set up Sysmon to capture various noteworthy events on a test Windows 10 workstation. Further, we will cover how to install your very own ELK stack which can be used to ingest this data.