I preface this post by stating that this isn't a new concept among development circles, but security professionals aren't always developers, so my hope is to help demystify and educate those recreational scripters, coders and anyone else interested in overcoming these types of obstacles.
I, like so many others, started down the path of developing something novel that I could share with the greater security community. In my weekend coding session (like most every weekend) I encountered a challenge that I have to assume many have, as well. The scenario was that I needed to understand how a specific Microsoft DLL was functioning, but 1) all I had was the compiled DLL and 2) no real technique (or so it may seem) to reference the DLL assembly and interactively step through the code.
The following tool-chain will be required for a vast majority of our investigation, while most any proficient researcher will likely already be familiar with the list. If not, not a problem, we will dive into the tools now.
- Visual Studio 2017 (Community Edition)
- Process Hacker2 (this will be used in an upcoming post)
- JetBrains DotPeek
- ILSpy
Visual Studio 2017 is a full featured IDE and extremely flexible, it is also the de-facto for Microsoft-centric development whether it be the standard SDK or cross platform CORE code. Therefore, we will be using that, and I am going to start this off by assuming you already have a Visual Studio project solution (e.g., .SLN). This can be a generic empty bootstrapper C# project and in my instance I am going to target a DLL called "Microsoft.Azure.Commands.Profile.dll". I know this is open-sourced within the Azure Github, but I didn't want to build the entire project and I also didn't want the extra .Net CORE build files. The intent is to demonstrate a technique to reference the compiled DLL in our project in the event that there isn't source code available.
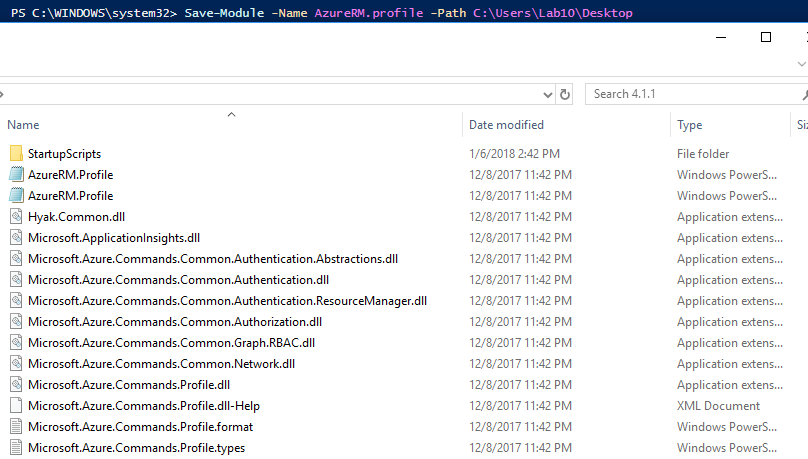
I used the following PS command to extract Powershell Cmdlet DLLs into a local folder so that I could reference the relevant ones within my own project.
Using ILSpy or DotPeek to Decompile the DLL
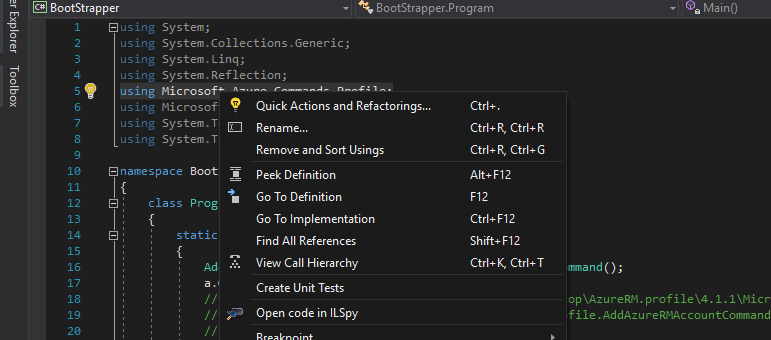
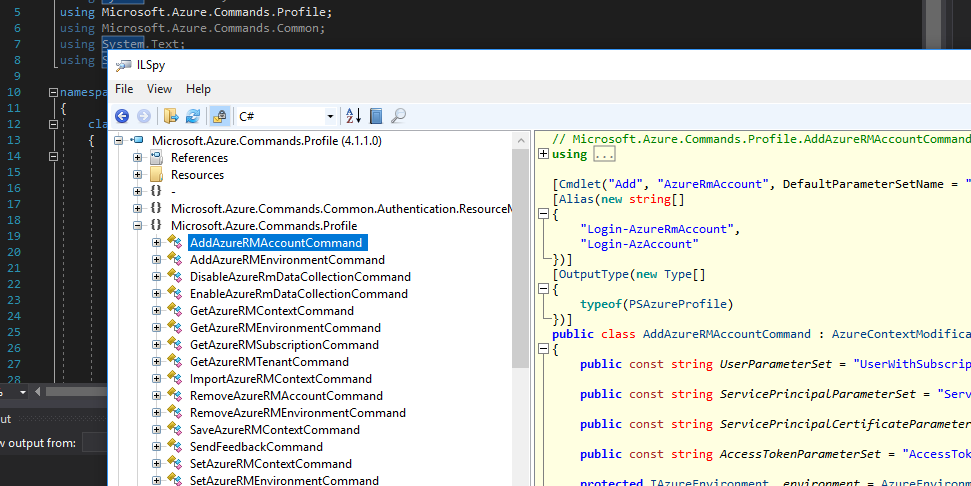
Ok yes we are decompiling so that we aren't altogether flying without a pilot. First logical step is to decompile the DLL in order to understand the class and it's inherent methods a bit better. For this operation we have a couple of options. If you have installed ILSpy then you can right click the referrenced Assembly (i.e., the DLL) by hovering over the imported "using" statement.
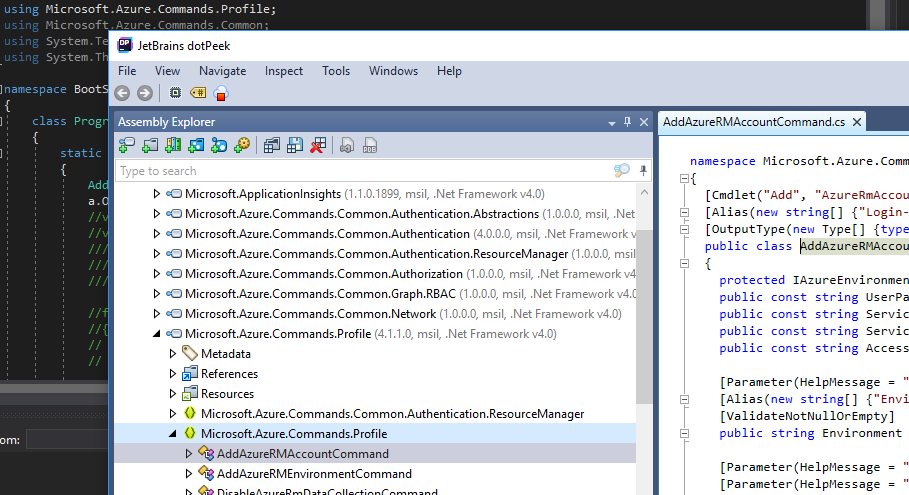
Similarly, DotPeek can be used to decompile the DLL. However, the right-click integration isn't afforded directly within VS2017. Personally, I use both ILSpy for the convenience of at-a-glance quick decompilation and the power of DotPeek, as we will see shortly, to drive this workflow.
The decompiled assembly provides a solid codebase to derive relevant details, such as methods we may want to call through our bootstrapper code. However, interactively stepping through the project with a debugger is still a challenge, so time to fix that.
Portable Database (PDB) and Symbol Files
To start, we need to understand a little about PDB files, which are also commonly referred to as Symbol files. A PDB file contains a number of important details such as class, method, compiler configurations, type references, and code/memory mapping instructions between the source code and the executable. These pieces of information are also known as Symbols. The PDB file may be available in the local DLL file or within local Symbol cache folders. If not within the local filesystem, then debuggers can also look to network Symbol servers. A PDB file is crucial to deconstructing an accurate source code representation and for displaying meaningful content rather than assembly or low level IL opcode, for example. A DLL will typically contain information about where to locate it's respective PDB, which can be viewed by invoking the DUMPBIN utility against the DLL.
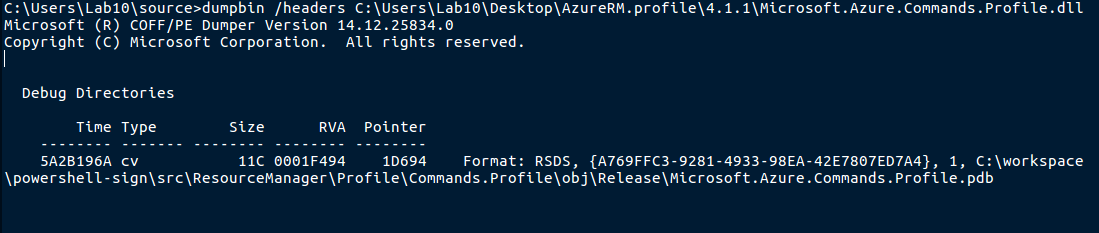
The GUID displayed within the output, in conjunction with the actual name of the DLL, is used to search for remote PDB files located on external Symbol servers when necessary.
Setting up DotPeek as a Symbol Server
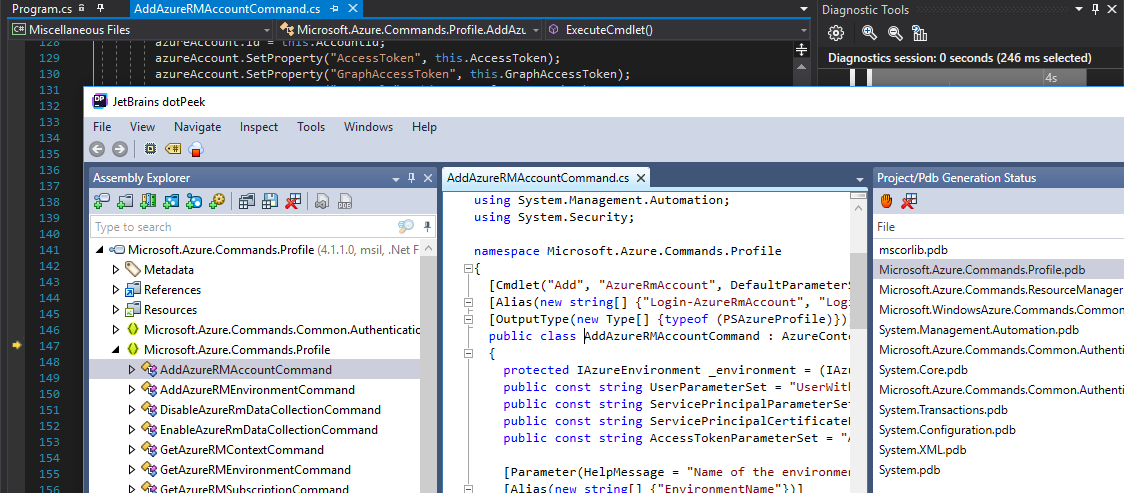
DotPeek can not only decompile but it can attempt to locate PDB files both locally and from remote Symbol servers. Visual Studio can do this as well, but adding DotPeek's power to decompile the DLL and also generate PDB files provides for a more powerful development workflow, as we see here on the far-right tab.
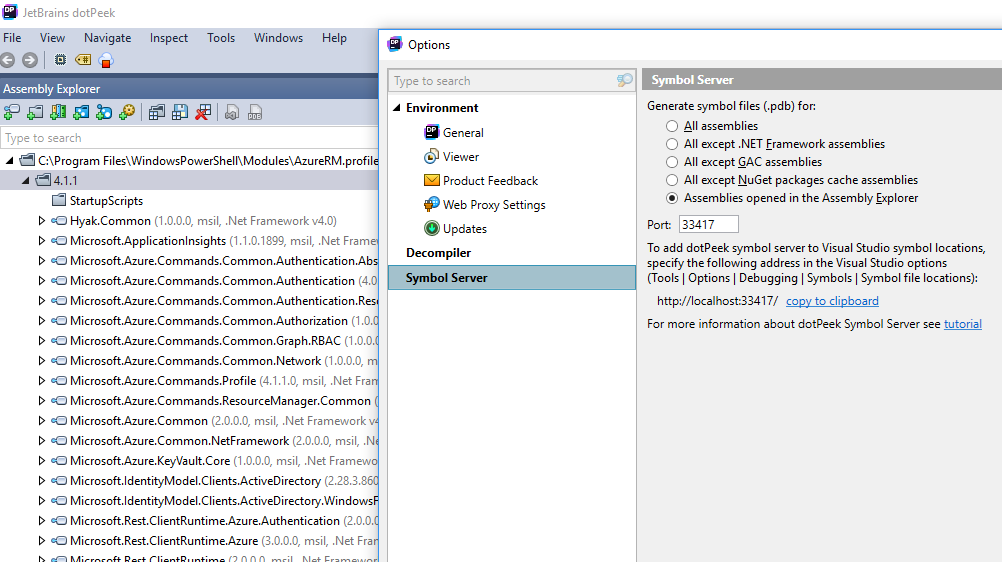
Configuration is rather minimal to get this working. Here we are telling the Symbol Server to only scope assemblies within our current DotPeek Assembly Explorer window, along with the listening IP address and port number. The latter will be configured within Visual Studio. We also need to start the Symbol Server via the Tools>Symbol Server drop-down menu.
Setting up Visual Studio Debugging
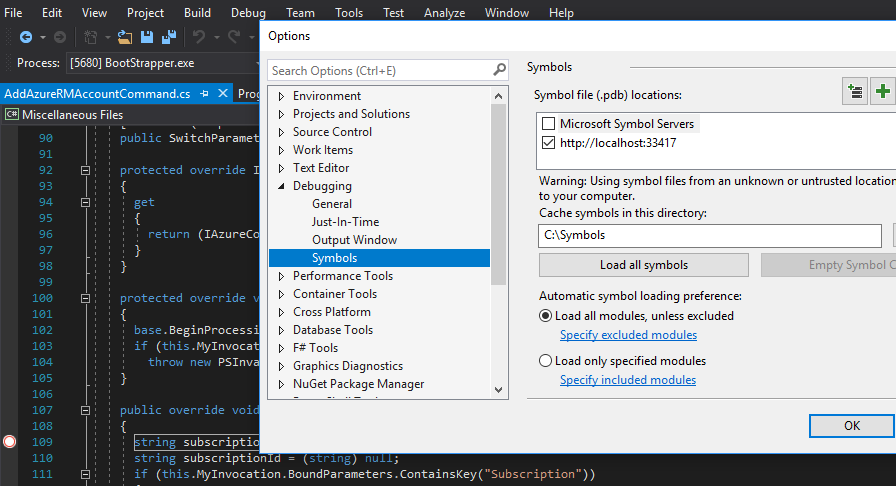
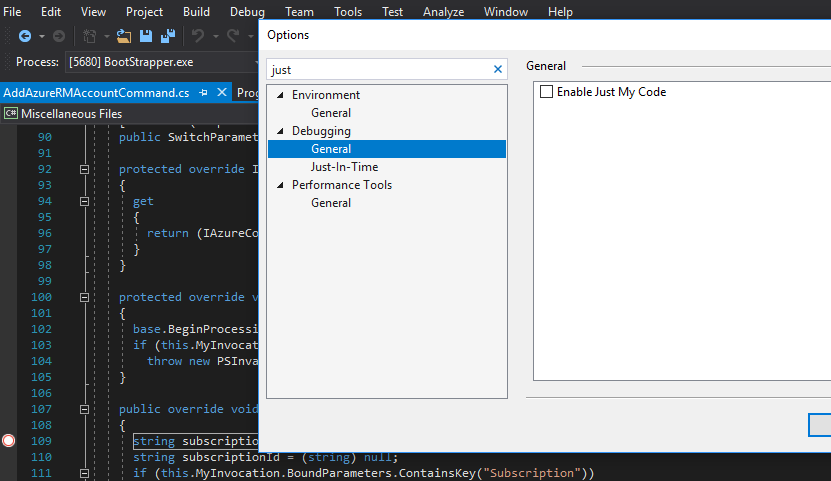
Visual Studio is also quite simple to setup as it generically connects to DotPeek as one of it's symbol servers. I say "one of" because we can define multiple locations to derive PDB files. Configuration is accessible from the Debug>Options drop-down menu. We also need to clear the Enable Just My Code in order to be inclusive of referenced assemblies.
Debugging our Code
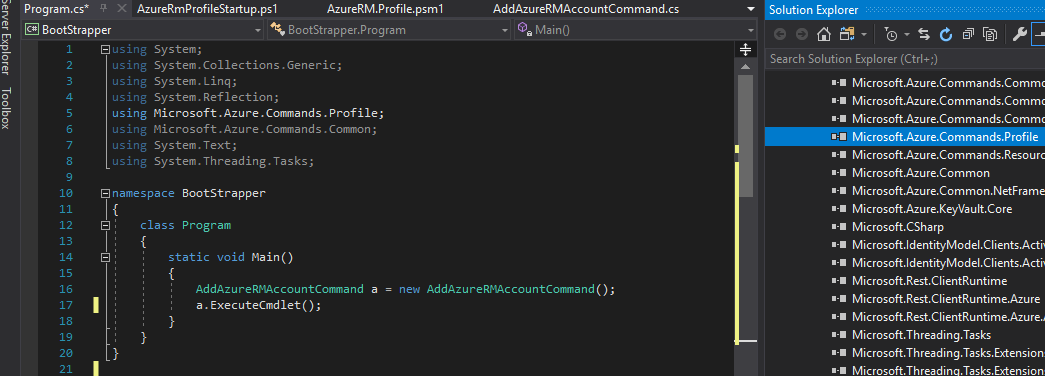
As I mentioned at the start of this post, I just stubbed a simple project called Bootstrapper that would contain a main section while instantiating a class object (derived from earlier decompiled code) so that we can investigate arbitrary code functionality. it should look something like the following.
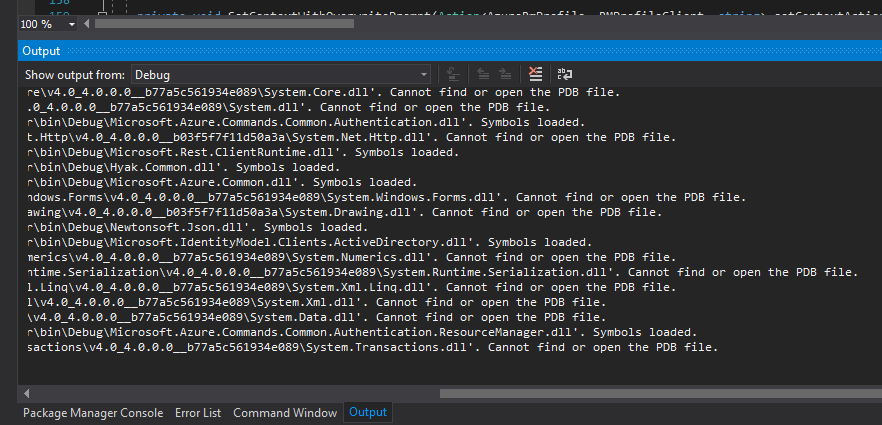
There may be times when the debugging output will contain statements declaring that symbols or a PDB file cannot be found. This can happen when only the DotPeek Symbol server is configured, and you are using symbol information exclusively provided by it. However, depending on the scope of your debugging ambitions, the extra PDB files may not be necessary. This is obviously something that you, the developer, will need to decide, but note that PDB files can become quite sizable so just be aware.
In the event that extra PDB files are required, such as those provided for native Microsoft DLLs, then we can make a configuration change to allow inclusion of Microsoft's Symbol Servers.
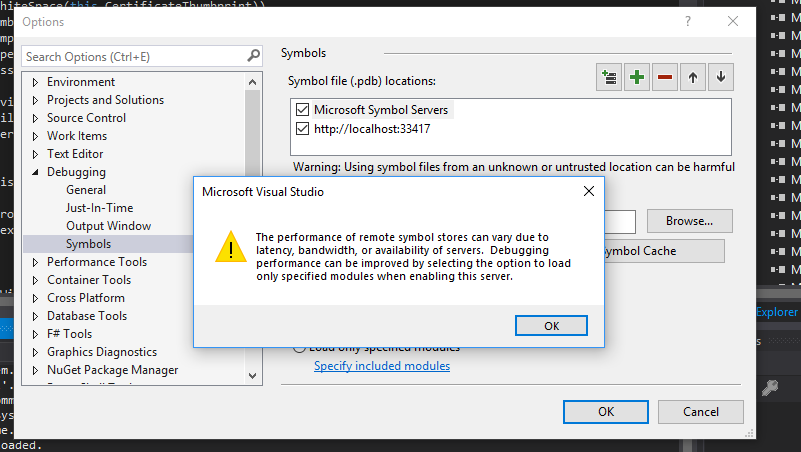
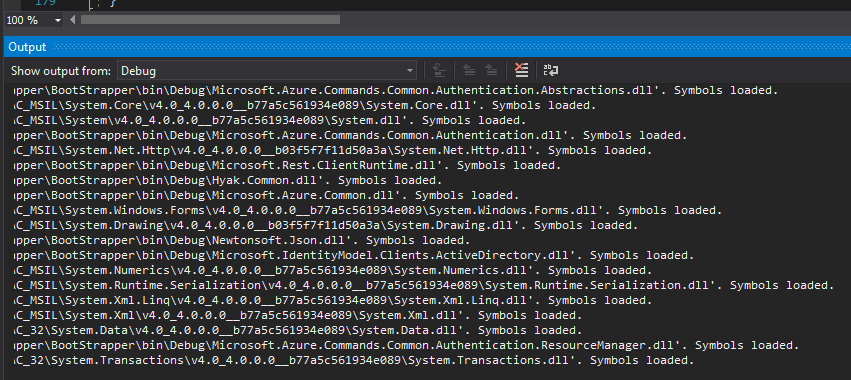
With the change applied, the new debugging output should look quite a bit more comprehensive as it now is able to identify the applicable PDB files. The lines should now end with "Symbols loaded".
Setting Function Breakpoints
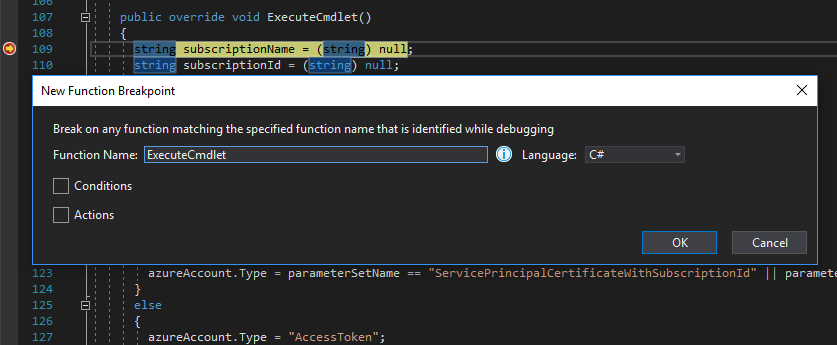
Although we may have the option of setting breakpoints within code that we control, in this case a method call within our main function, there will come a time that we need to set a breakpoint within code that we don't have immediate access to. One solution is to set Function Breakpoints within the project. This will run the code, step into the DLL for example, and will pause once the debugger reaches the code block containing the respective function name. This feature can be located at the Debug>New Breakpoint>Function Breakpoint drop-down menu.
Conclusion
I sincerely hope some found this interesting and provided the knowledge to overcome this specific challenge. Also, I sort of jumped ahead by assuming that we were debugging the code by setting breakpoints, and that is almost always the case. However, depending on how we are accessing the specific application, through process attachment, Visual Studio would have detected a debugging event and asked if we wanted to Break or Start Debugging our code automatically. That said, I will be visiting process debugging in an upcoming post.
The team at Stacktitan shares a common mindset that learning development disciplines only proves to enhance a person's security trade-craft and overall knowledge. My intent is to continue with the Code Survival series as I tend to really enjoy and depart on various DevOps related tangents. Also, message us if you have an interesting topic that you would like to see posted here.
References and Further Reading
LSpy - decompiler architecture
ILSpy - Ensuring correctness of ILAst
Specify symbol (.pdb) and source files in the Visual Studio debugger
DotPeek Features: Decompile .NET assemblies to C# or IL